Alphaprop Insights Webinar: Market update on indirect real estate investments

Insights into the Swiss market for indirect real estate investments: current trends, returns and developments after the interest rate turnaround at a glance.
Alphaprop Webinar: Auditing ESG KPIs according to AMAS guidelines
Insights into the AMAS audit requirement for ESG KPIs from 2028. Industry experts shed light on the auditing process, legal deadlines and data structures.
Indirect Swiss real estate investments in June 2026
Solid returns and record capital inflows for Swiss real estate funds in 2026, but growing political risks challenge investors
REIDA Total Return Benchmark
The market for investment properties is often opaque. Learn how to effectively use benchmark data and performance metrics in your valuation.
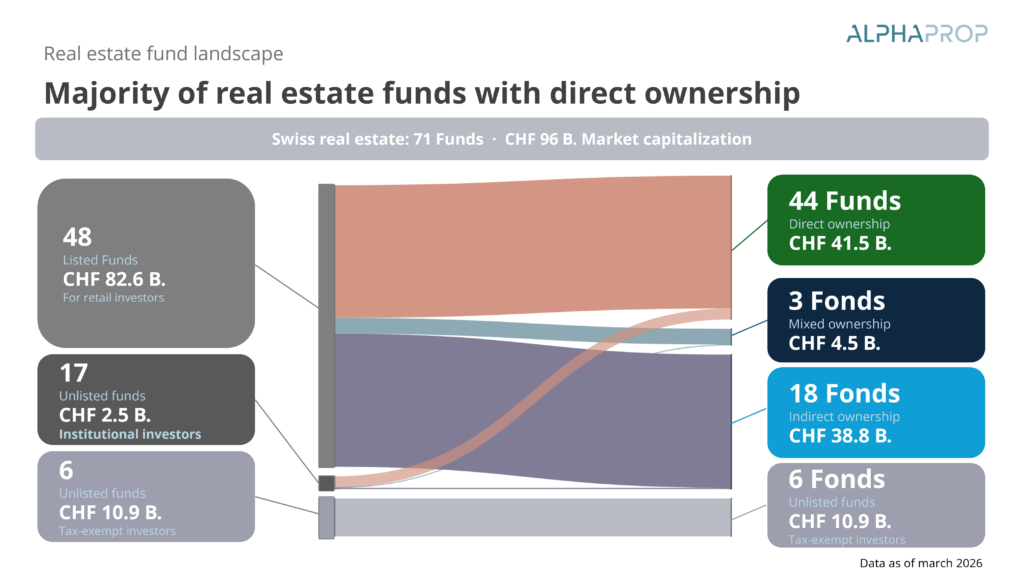
Real estate funds with direct property ownership
Example of tax benefits of real estate funds with direct property ownership for private investors in Zurich and Basel.
Alphaprop Insights Webinar: Tax differences between funds with direct vs. indirect real estate holdings
Focus on the tax framework for direct and indirect real estate funds.
What is required for data entry in the REIDA CO2e report?

REIDA reporting: How to prepare real estate data in a structured way. An overview of the most important steps in data collection.
Participation in the REIDA benchmark: insight into practice with Berninvest

Berninvest takes part in the REIDA benchmark and reports on its practical experience. Find out more in the interview with Sebastian Gyr.
Indirect Swiss real estate investments in February 2026
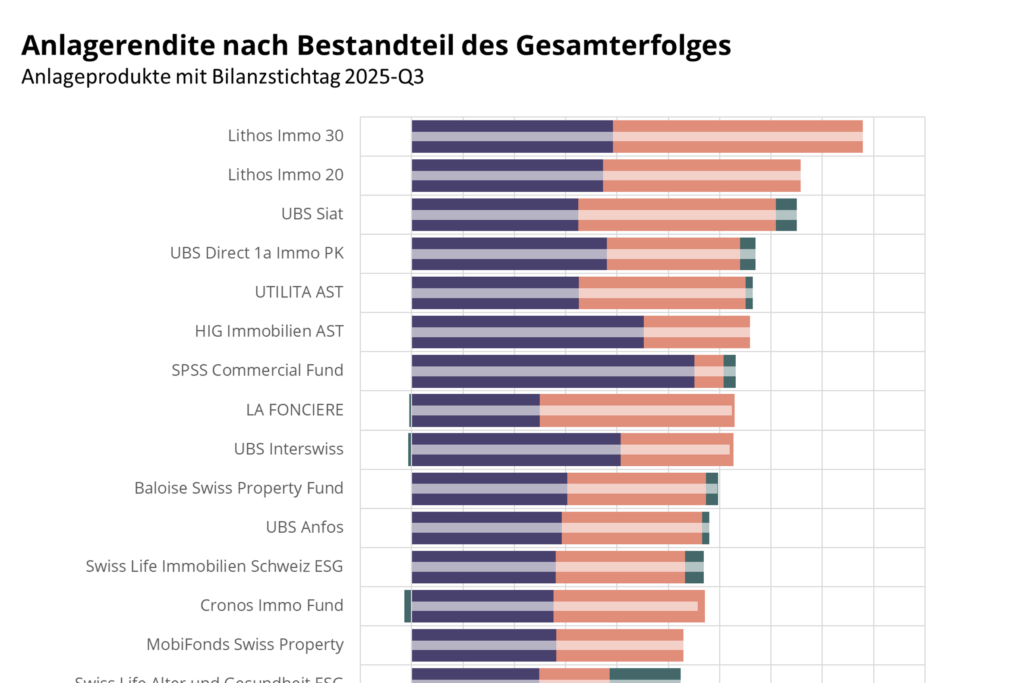
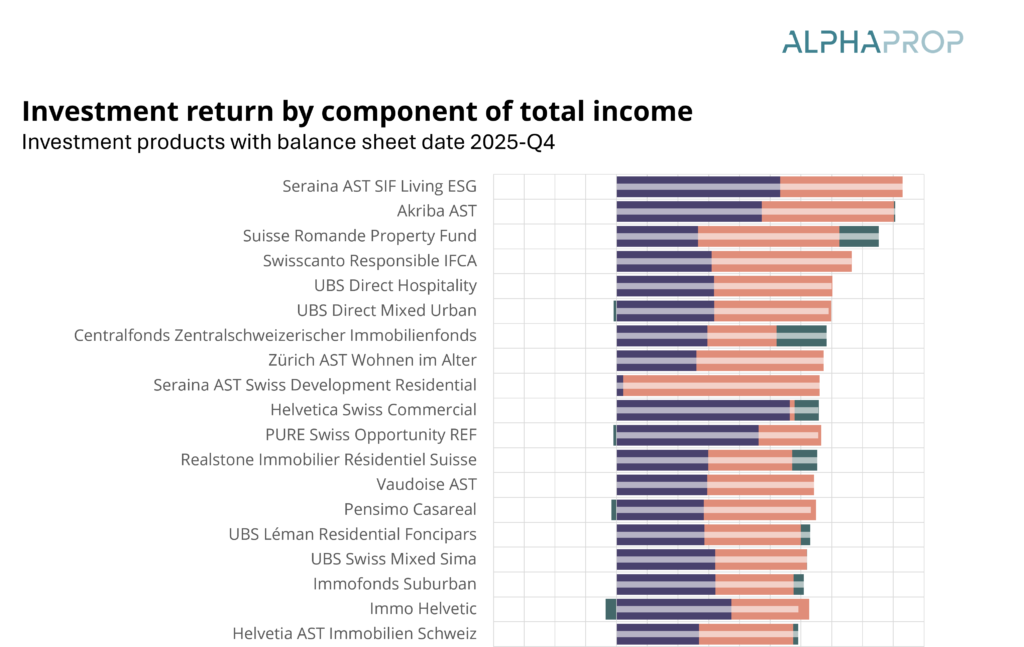
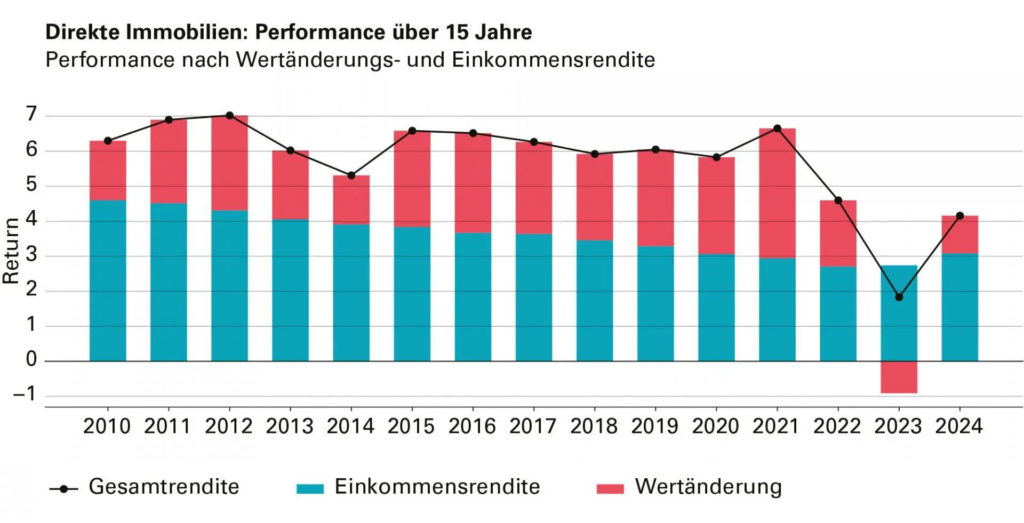
Significant revaluations are back. Investment products achieved clearly positive returns as of 30 September. Operating income remains solid, whilst individual products are benefiting from significant capital gains.
Release Alphaprop 2.0 – Now featuring historical agios

Alphaprop has a new look: the latest updates have, in particular, incorporated historical premiums. The data portal has also been given a visual refresh.