An overview of the main updates
Historical Agios
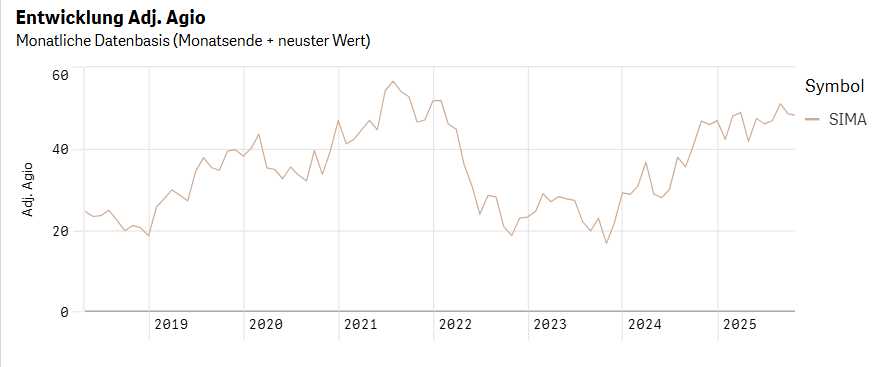
The “4. Prices, Performance & Premium” sheet now displays historical agio values in graphical form. The “Agio Type” drop-down menu can be used to select the type of agio to be displayed (agio, adjusted agio, adjusted agio before deferred tax).
Users with the Portfolio Upload module can also view the historical premium (adjusted premium) on an asset-weighted basis for their portfolio.
A product’s rating over time
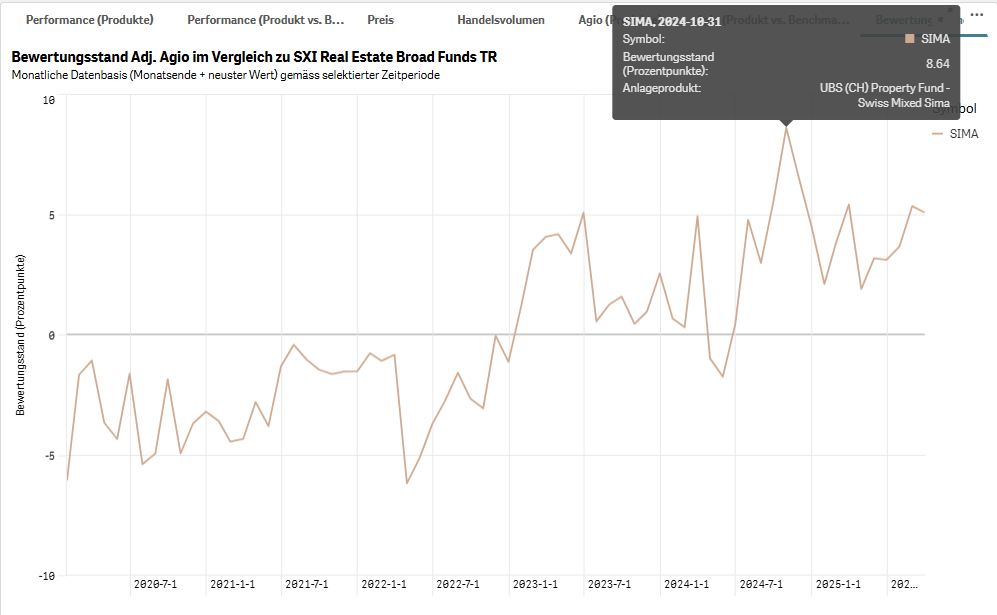
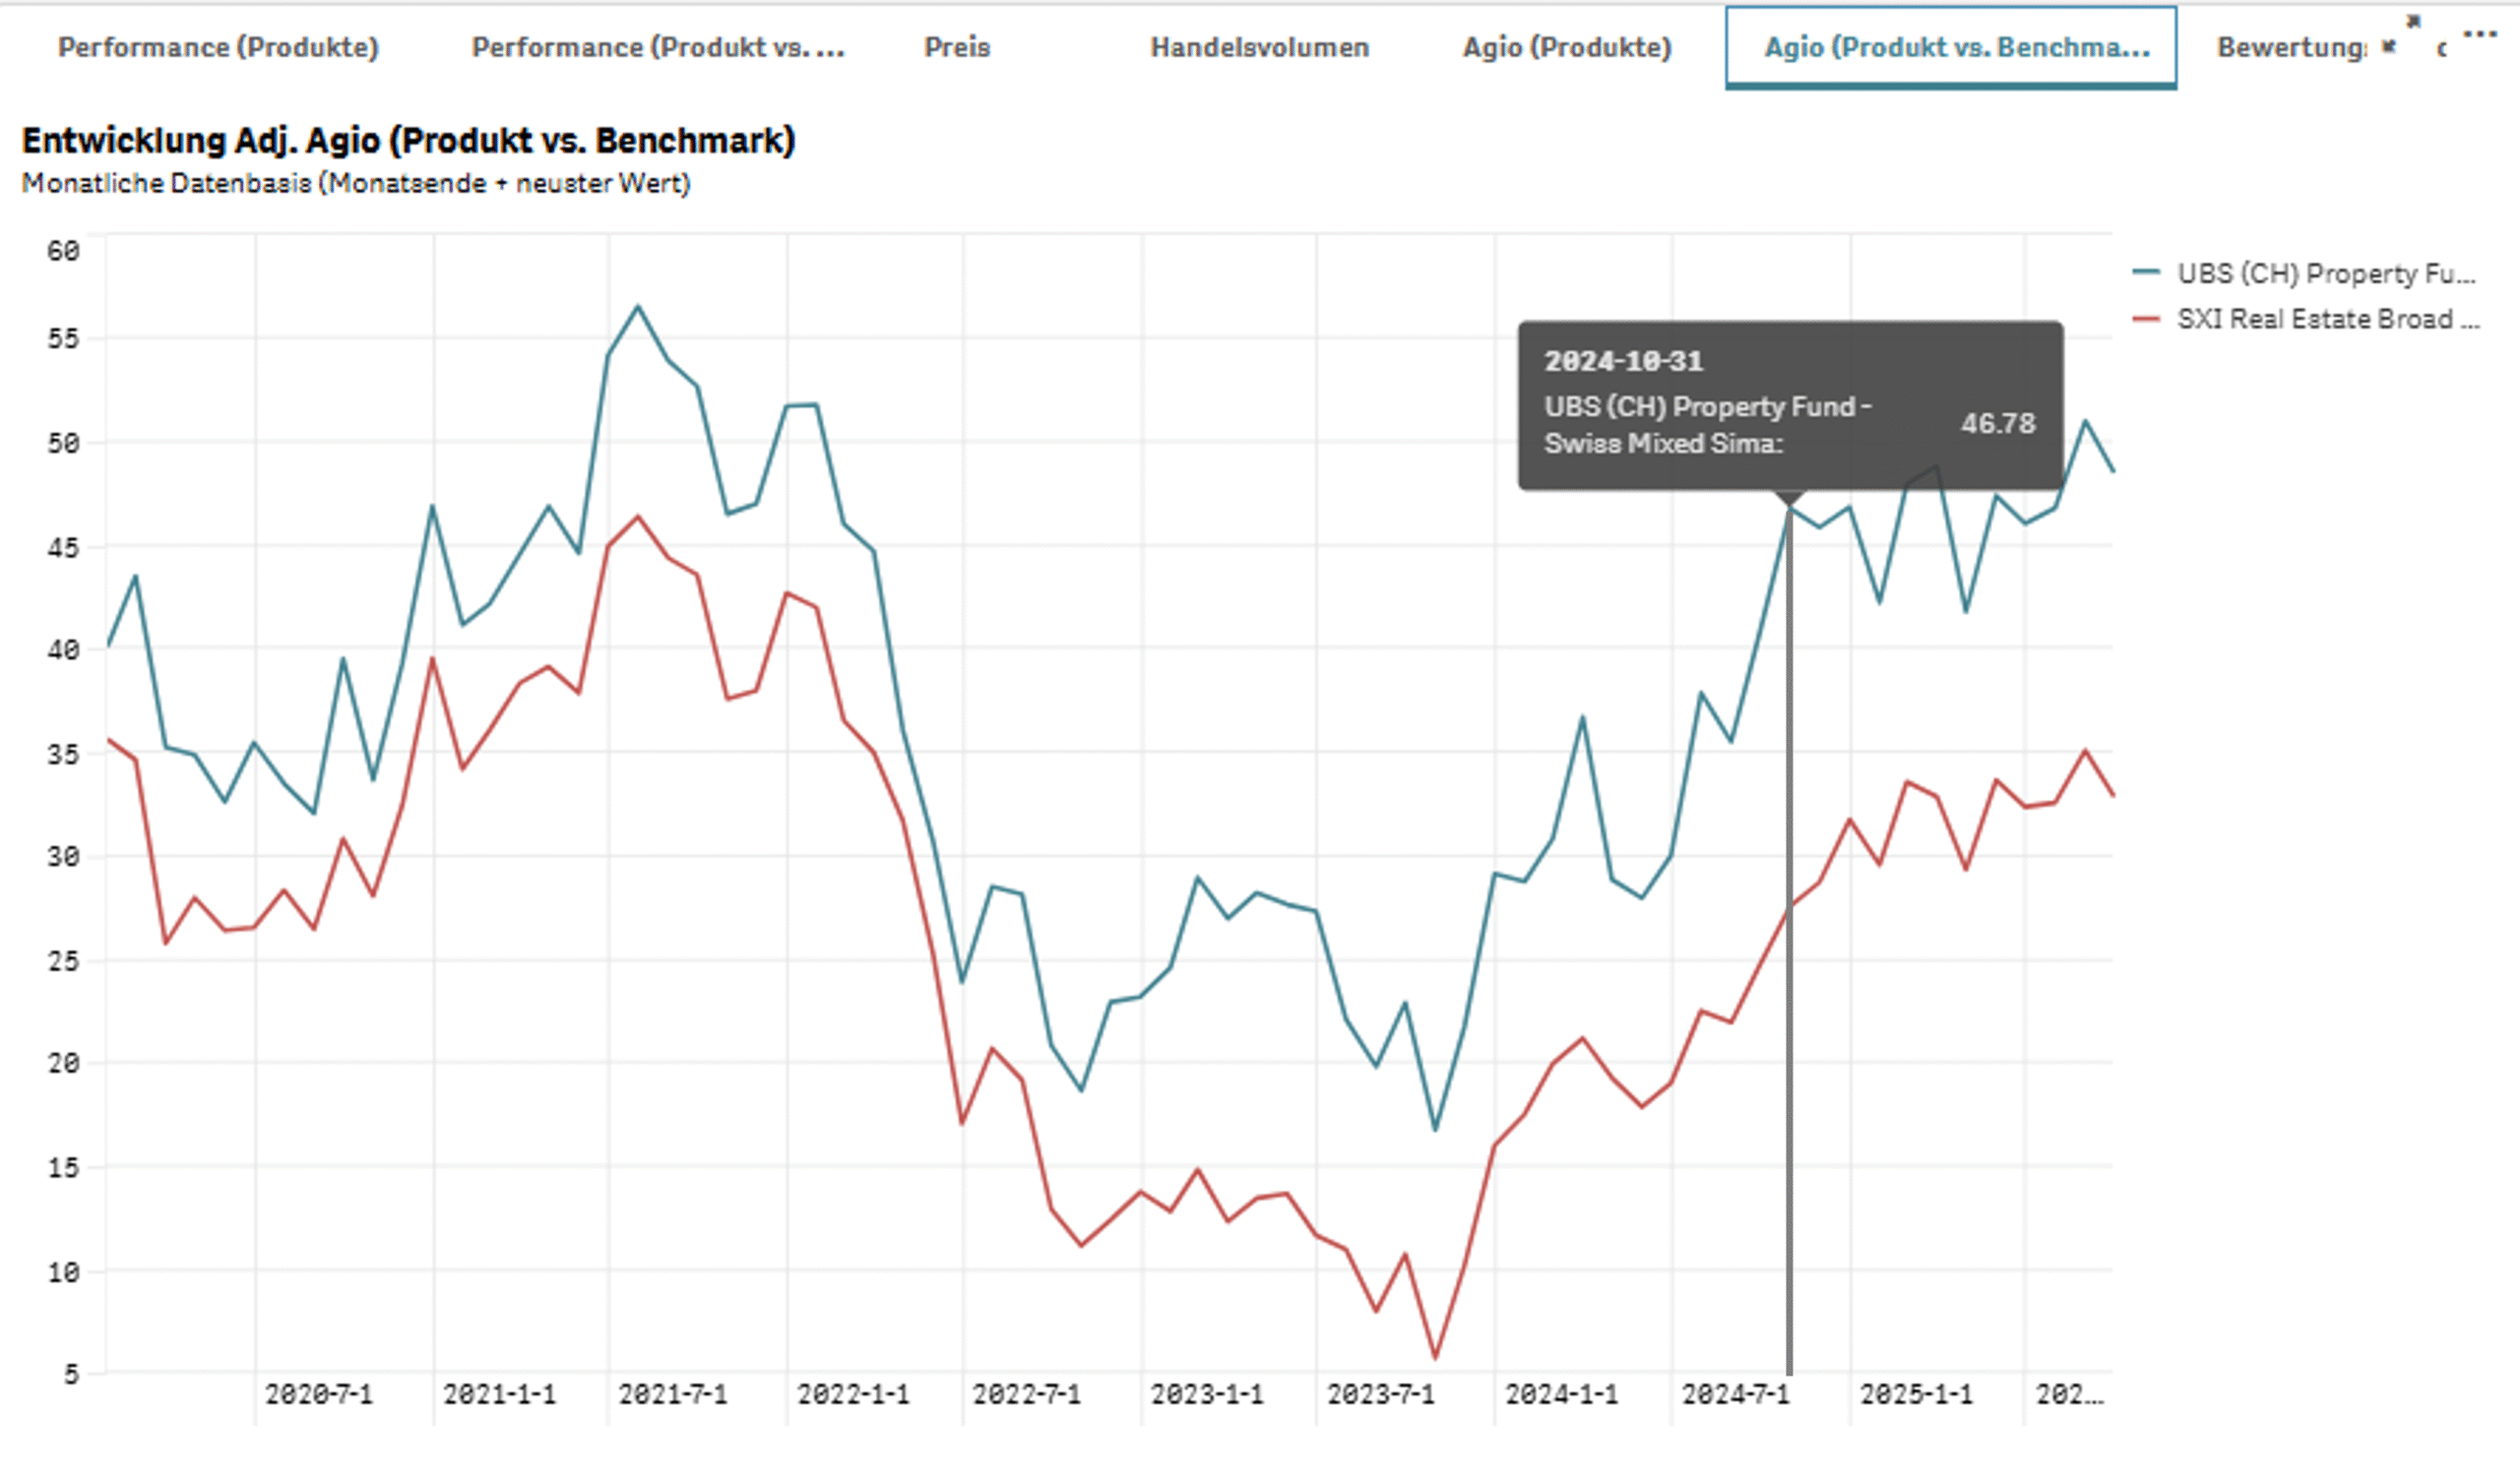
Many listed products trade at a relatively constant higher/lower value compared to aindex’s agio. To easily analyse the trend in a product’s agio relative to the index, the ‘4. Prices, Performance & Agio’ sheet now allows you to view a product’s valuation relative to a benchmark over time. The chart shows how a product’s valuation has developed in relation to the benchmark.
A concrete example with SIMA
The chart below shows the valuation of the SIMA from 31 January 2020 to 30 September 2025 compared with the SWIIT. As at 31 October 2024, the SIMA’s valuation relative to the SWIIT over the specified period stands at 8.64 (see first chart). This means that, on this date, the agio of this product is approximately 8.64 percentage points above the average agio difference for the selected period when compared to the SWIIT. For comparison, the adjacent chart shows the historical development of the adjusted agio of the SIMA and the SWIIT over the same period. The same date (31 October 2024) is highlighted for illustrative purposes.
Extension of benchmark reports
The comprehensive benchmark and product reports, which can be generated as PDF or Excel files, have been expanded. For all listed products, the adjusted agio, dividend yield and other market data are now included.
Until now, benchmark values (excluding ESG) were only calculated once full data coverage was available. We now calculate an interim benchmark once index coverage reaches a threshold of 25%. The coverage level is specified in the report.
Historical net asset values, net assets, number of shares and dividends
In the “4. Prices, Performance & Agio” sheet, it is now possible to obtain a historical overview of the net asset values and dividends for individual products.
The ‘Inventory Values’ table contains the following for each product:
- Date inventory value
- inventory value
- net assets
- Number of shares
The Dividends table lists:
- Date Ex-Dividend
- Dividend
The Alphaprop data portal supports the analysis and comparison of indirect real estate investments
- A clear, intuitive dashboard covering the entire universe of Swiss indirect real estate investments
- Used by leading asset managers, pension funds, advisers and product providers
- Over 165 products with over CHF 180 billion in net assets
- Analysis capabilities down to the individual property level (over 9,500 properties)
- Generate clear product comparisons and benchmark reports as PDF files
- Upload your own indirect or direct portfolio and view asset-weighted performance
Changes in net assets
As with the “4. Prices, Performance & Agios” sheet, the historical development of net assets can now also be tracked in the “3. Financial Data & Fees” sheet. The table can be found in the final tab, “Change in Net Assets”. This table presents all movements in net assets based on the available financial data. The following movements are displayed for each product and year:
- Net assets at the start of the financial year
- Entries/Balance of transactions
- Total result
- Net assets at the end of the financial year
The net assets at the end of a financial period are equal to the net assets at the start of the new financial period.
For each transaction, the relevant account is listed so that the amount can be traced back to the financial data.
Table for ESG Benchmarks
As there have been frequent requests for an overview of ESG benchmark values, a complete overview of all common benchmark values (e.g. SWIIT, KGAST, REIDA) for ESG KPIs is now available in the ’ESG KPIs’ sheet. The full dataset is presented in a table and can be downloaded if required.
As before, you can select a benchmark from the drop-down menu and view it in the graphs showing the environmental indicators in comparison with the products.
Linking of properties to GWR
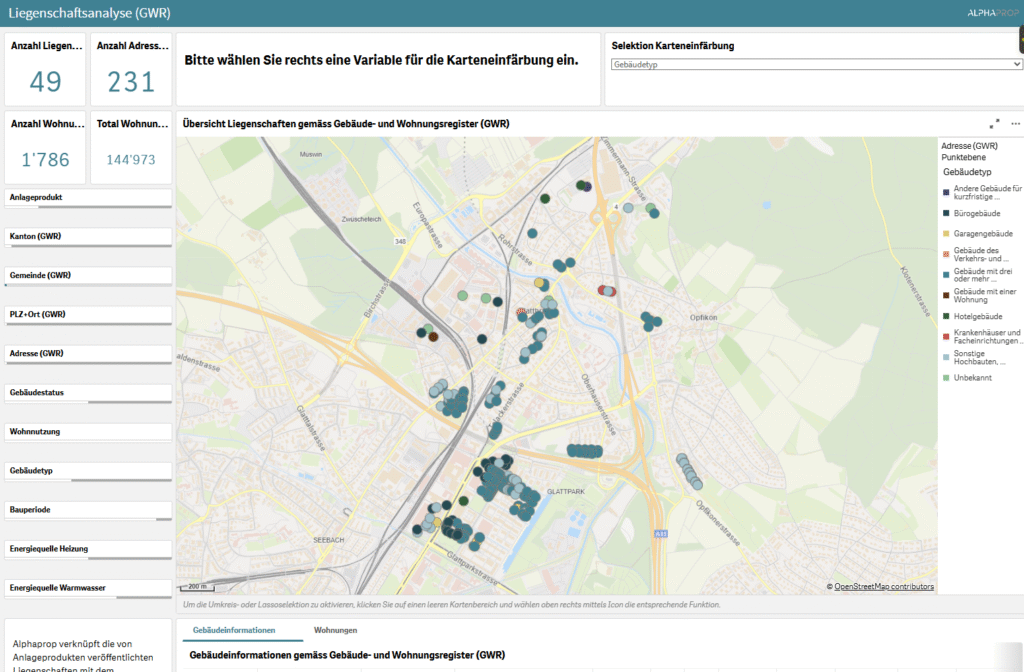
We have assigned one or more EGRID numbers (Federal Property Identification Numbers) to all properties in Alphaprop. This allows the properties to be linked to data from the GWR register, providing information such as the property’s construction period or heating system. The relevant data can be viewed in the new sheet “Property Analysis (GWR)”.
New filtering options for product status
Investment products change over time. New products are launched, existing ones merge, or are liquidated. In the “Investment Product Selection” sheet, you can now filter by status to display only active products.
The “Product Status” filter can be found at the bottom of the “Master Data” category. Available options: Active, Merged (Year), Liquidated (Year).
Adjusting product symbols
There were some discrepancies between the product symbols used by SIX and their designations in Alphaprop. This occurred in particular with products that were listed only after being included in the Alphaprop data universe. This discrepancy has now been resolved. Where available, the official SIX symbols are used to identify all investment products. For future IPOs, the symbols will also be updated to match the official SIX designations.
Visual refresh
In addition to the content updates, the data portal has been given a visual makeover. The new look is more modern and consistent with the Alphaprop design.
Access for all existing users
All users of the data portal now have access to the new features at no extra cost.
Are you not yet a customer and would like to try out the data portal without obligation? Please feel free to contact us for a free trial: contact@alphaprop.ch