Swiss real estate funds and investment foundations on the CO2 reduction path: Update 2025
Where will the reduction path and environmentally relevant indicators for real estate funds and investment foundations stand in 2025? We examine the current state of reporting for indirect Swiss real estate investments.
Indirect real estate investments and their CO2 reduction paths: Update 2024
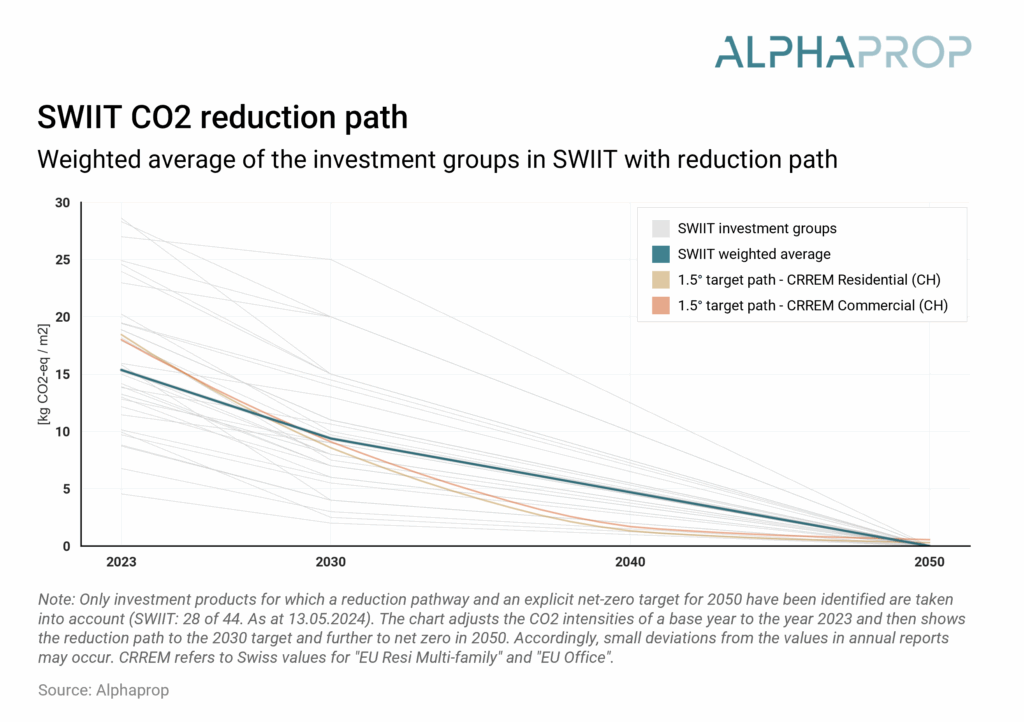
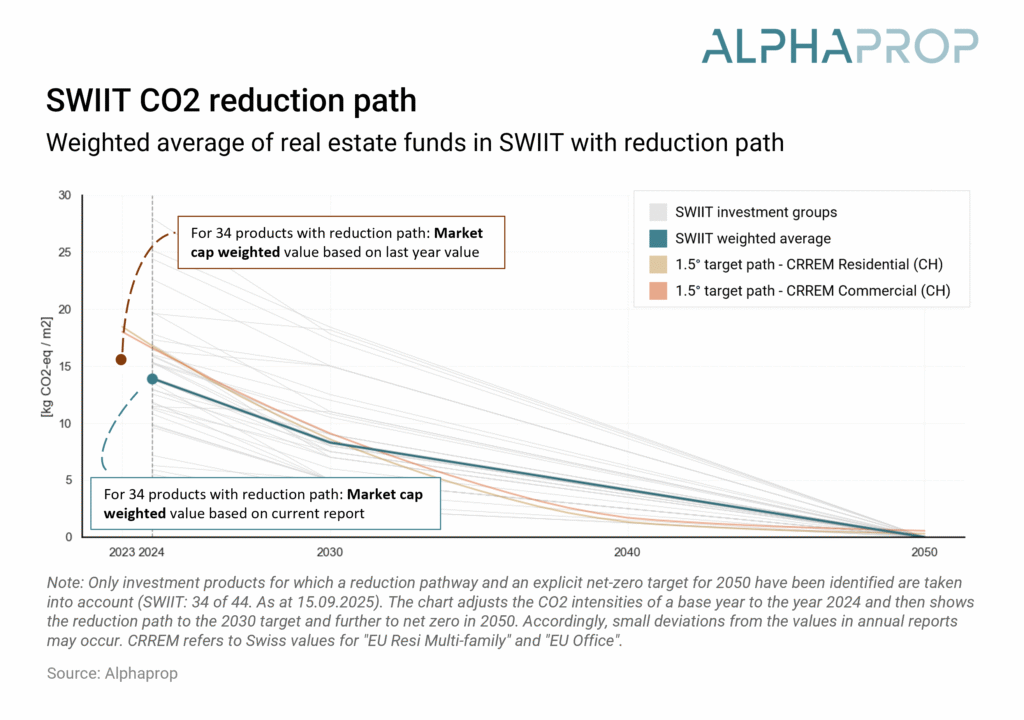
Weighted by market capitalization, environmentally relevant key figures are available for 100% of the SWIIT and 95% of the KGAST. Around half of the investment products in both indices have a reduction path.