
The annual reports as at December 31 and the corresponding valuations were eagerly awaited again this year. The reports always provide an indicator of how the investment vehicles for indirect Swiss real estate investments are performing in an environment of higher interest rates. This brief analysis summarizes the current market situation and the reports for the investment vehicles with a balance sheet date of 31.12.
The market for listed real estate investments continued to recover in the first months of 2024.
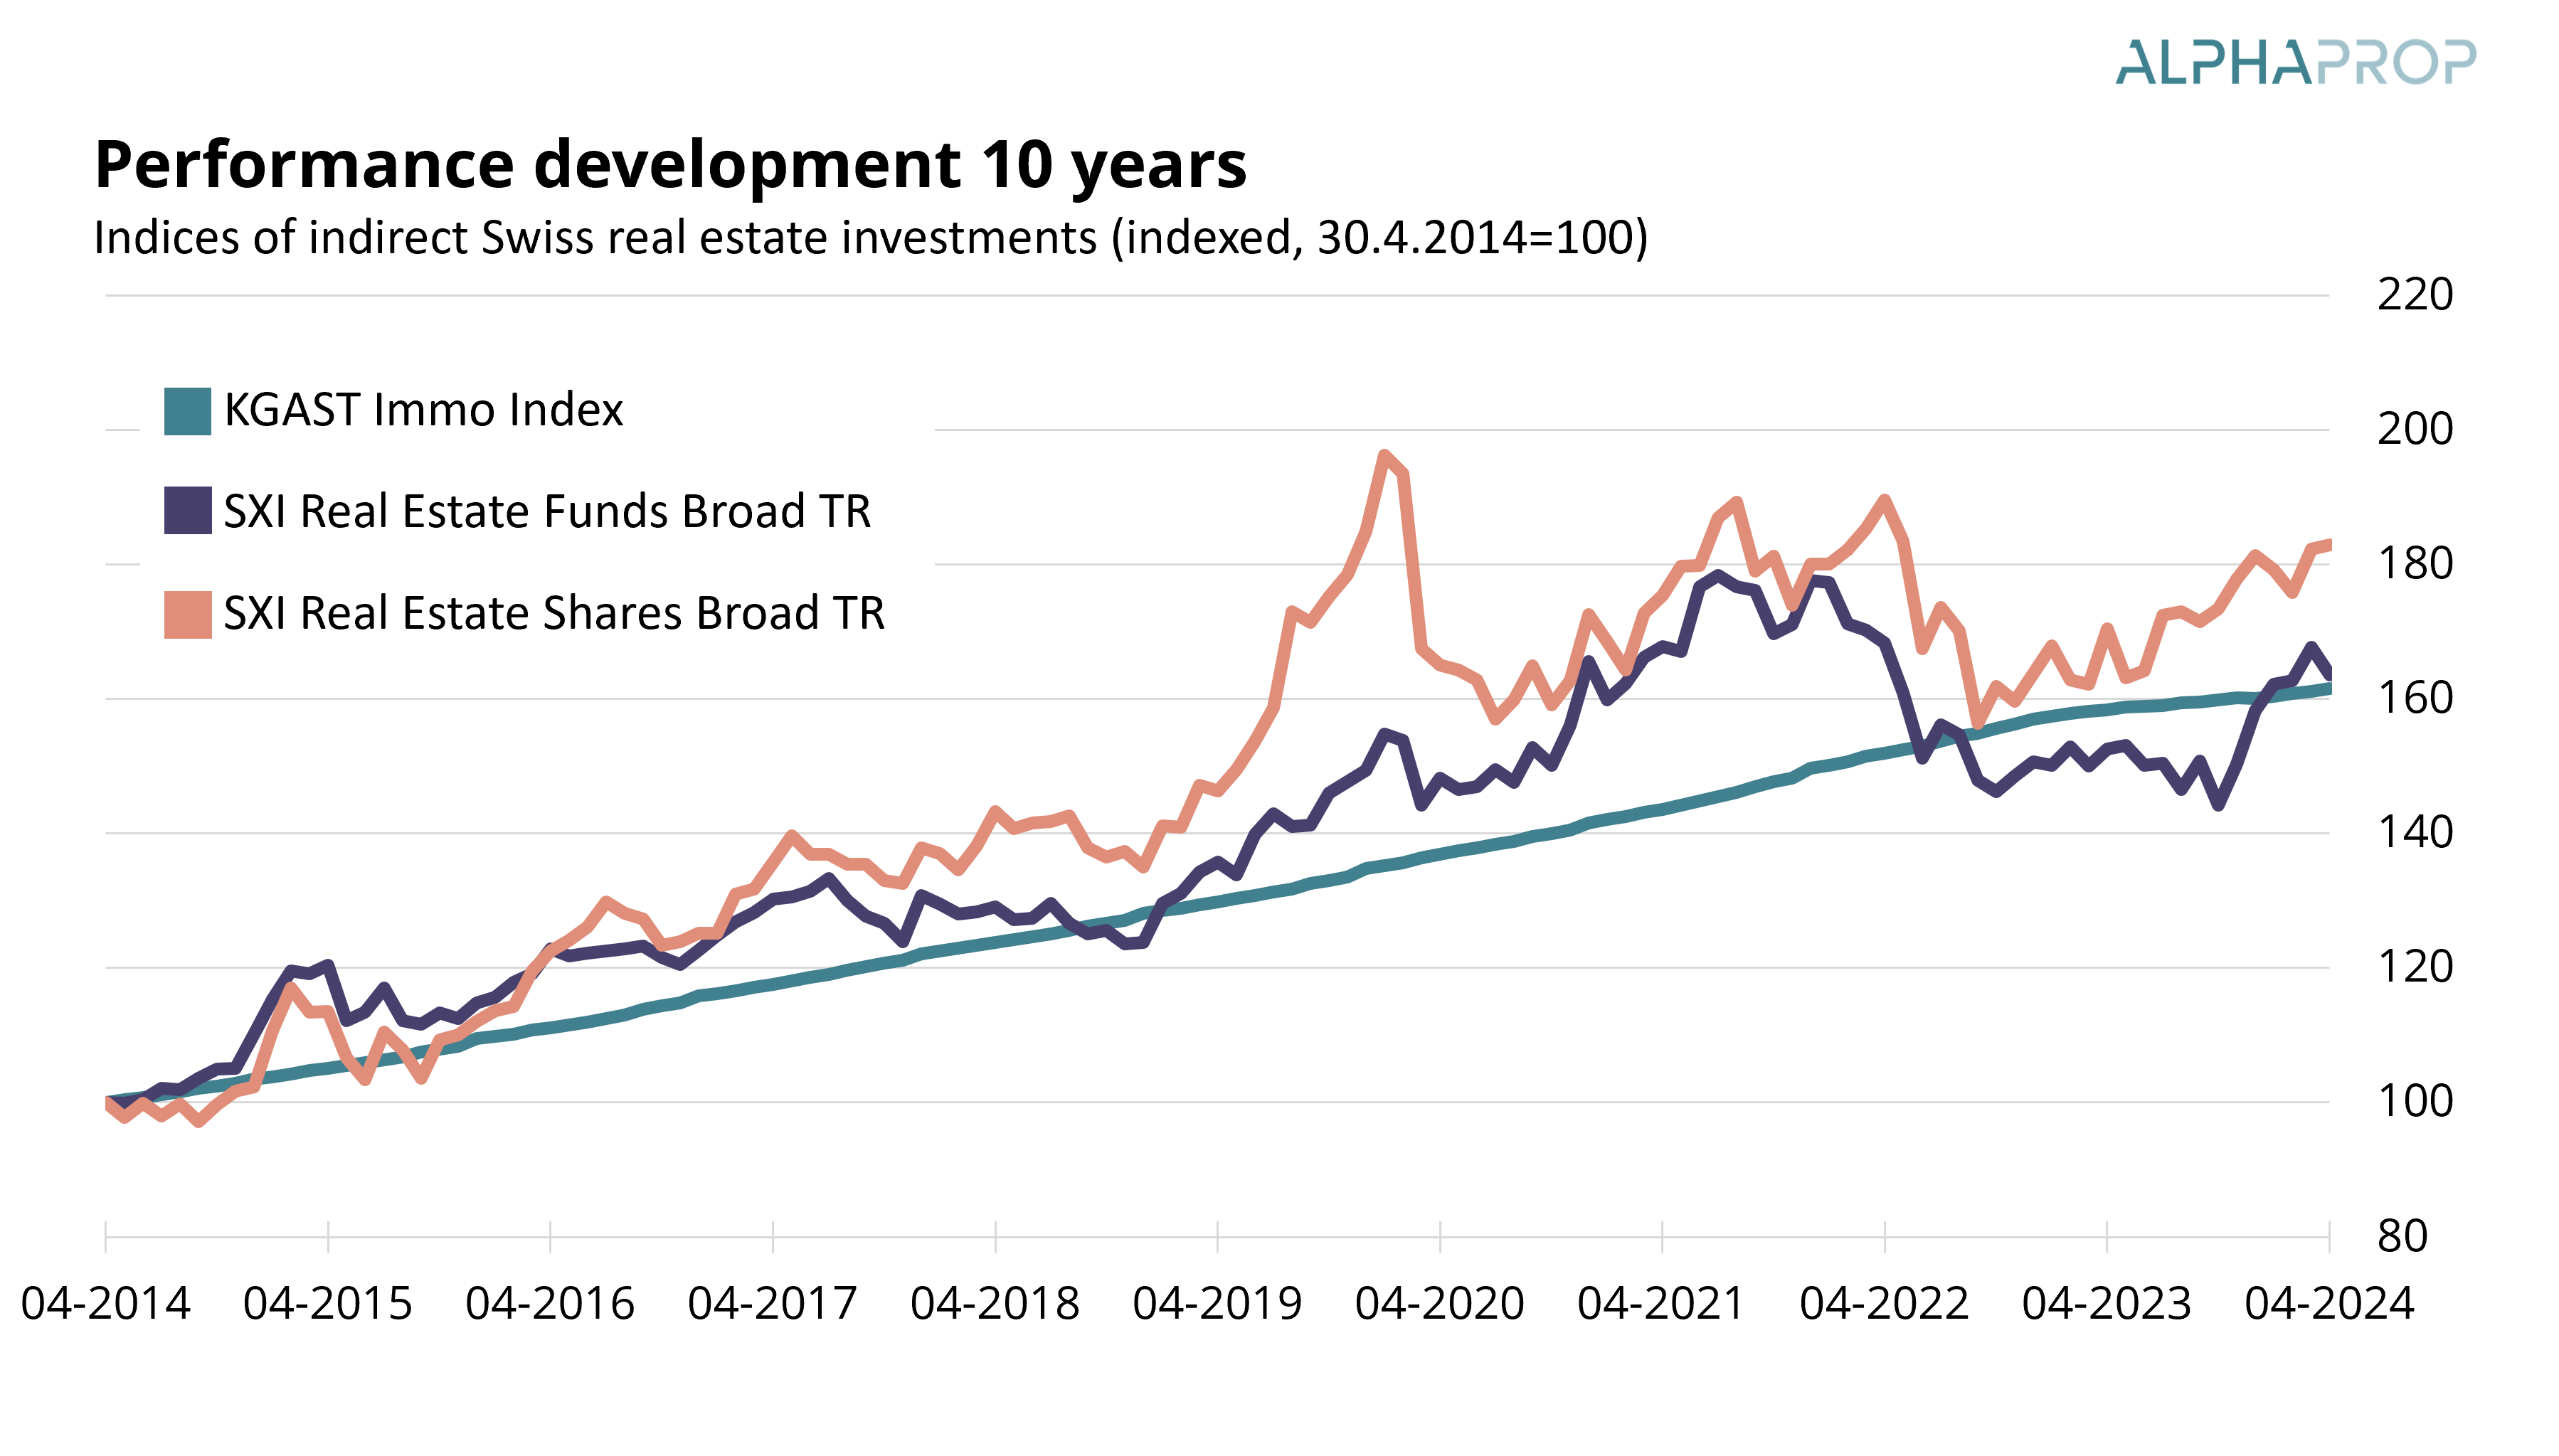
As at the end of April, the index of listed funds SWIIT YTD was up 3.31%, listed equities (REAL) were up 0.90% and the KGAST Immo Index was up 0.93%. In a 10-year comparison, the listed funds slightly outperformed the KGAST Immo Index.
In line with the positive performance of the listed vehicles, many players are active with capital increases. Funds and investment foundations have already announced capital increases of CHF 2.4 billion for 2024. More than CHF 500 million has been subscribed so far and, thanks to the clearly positive agios, further capital increases by listed funds should almost automatically be fully subscribed.
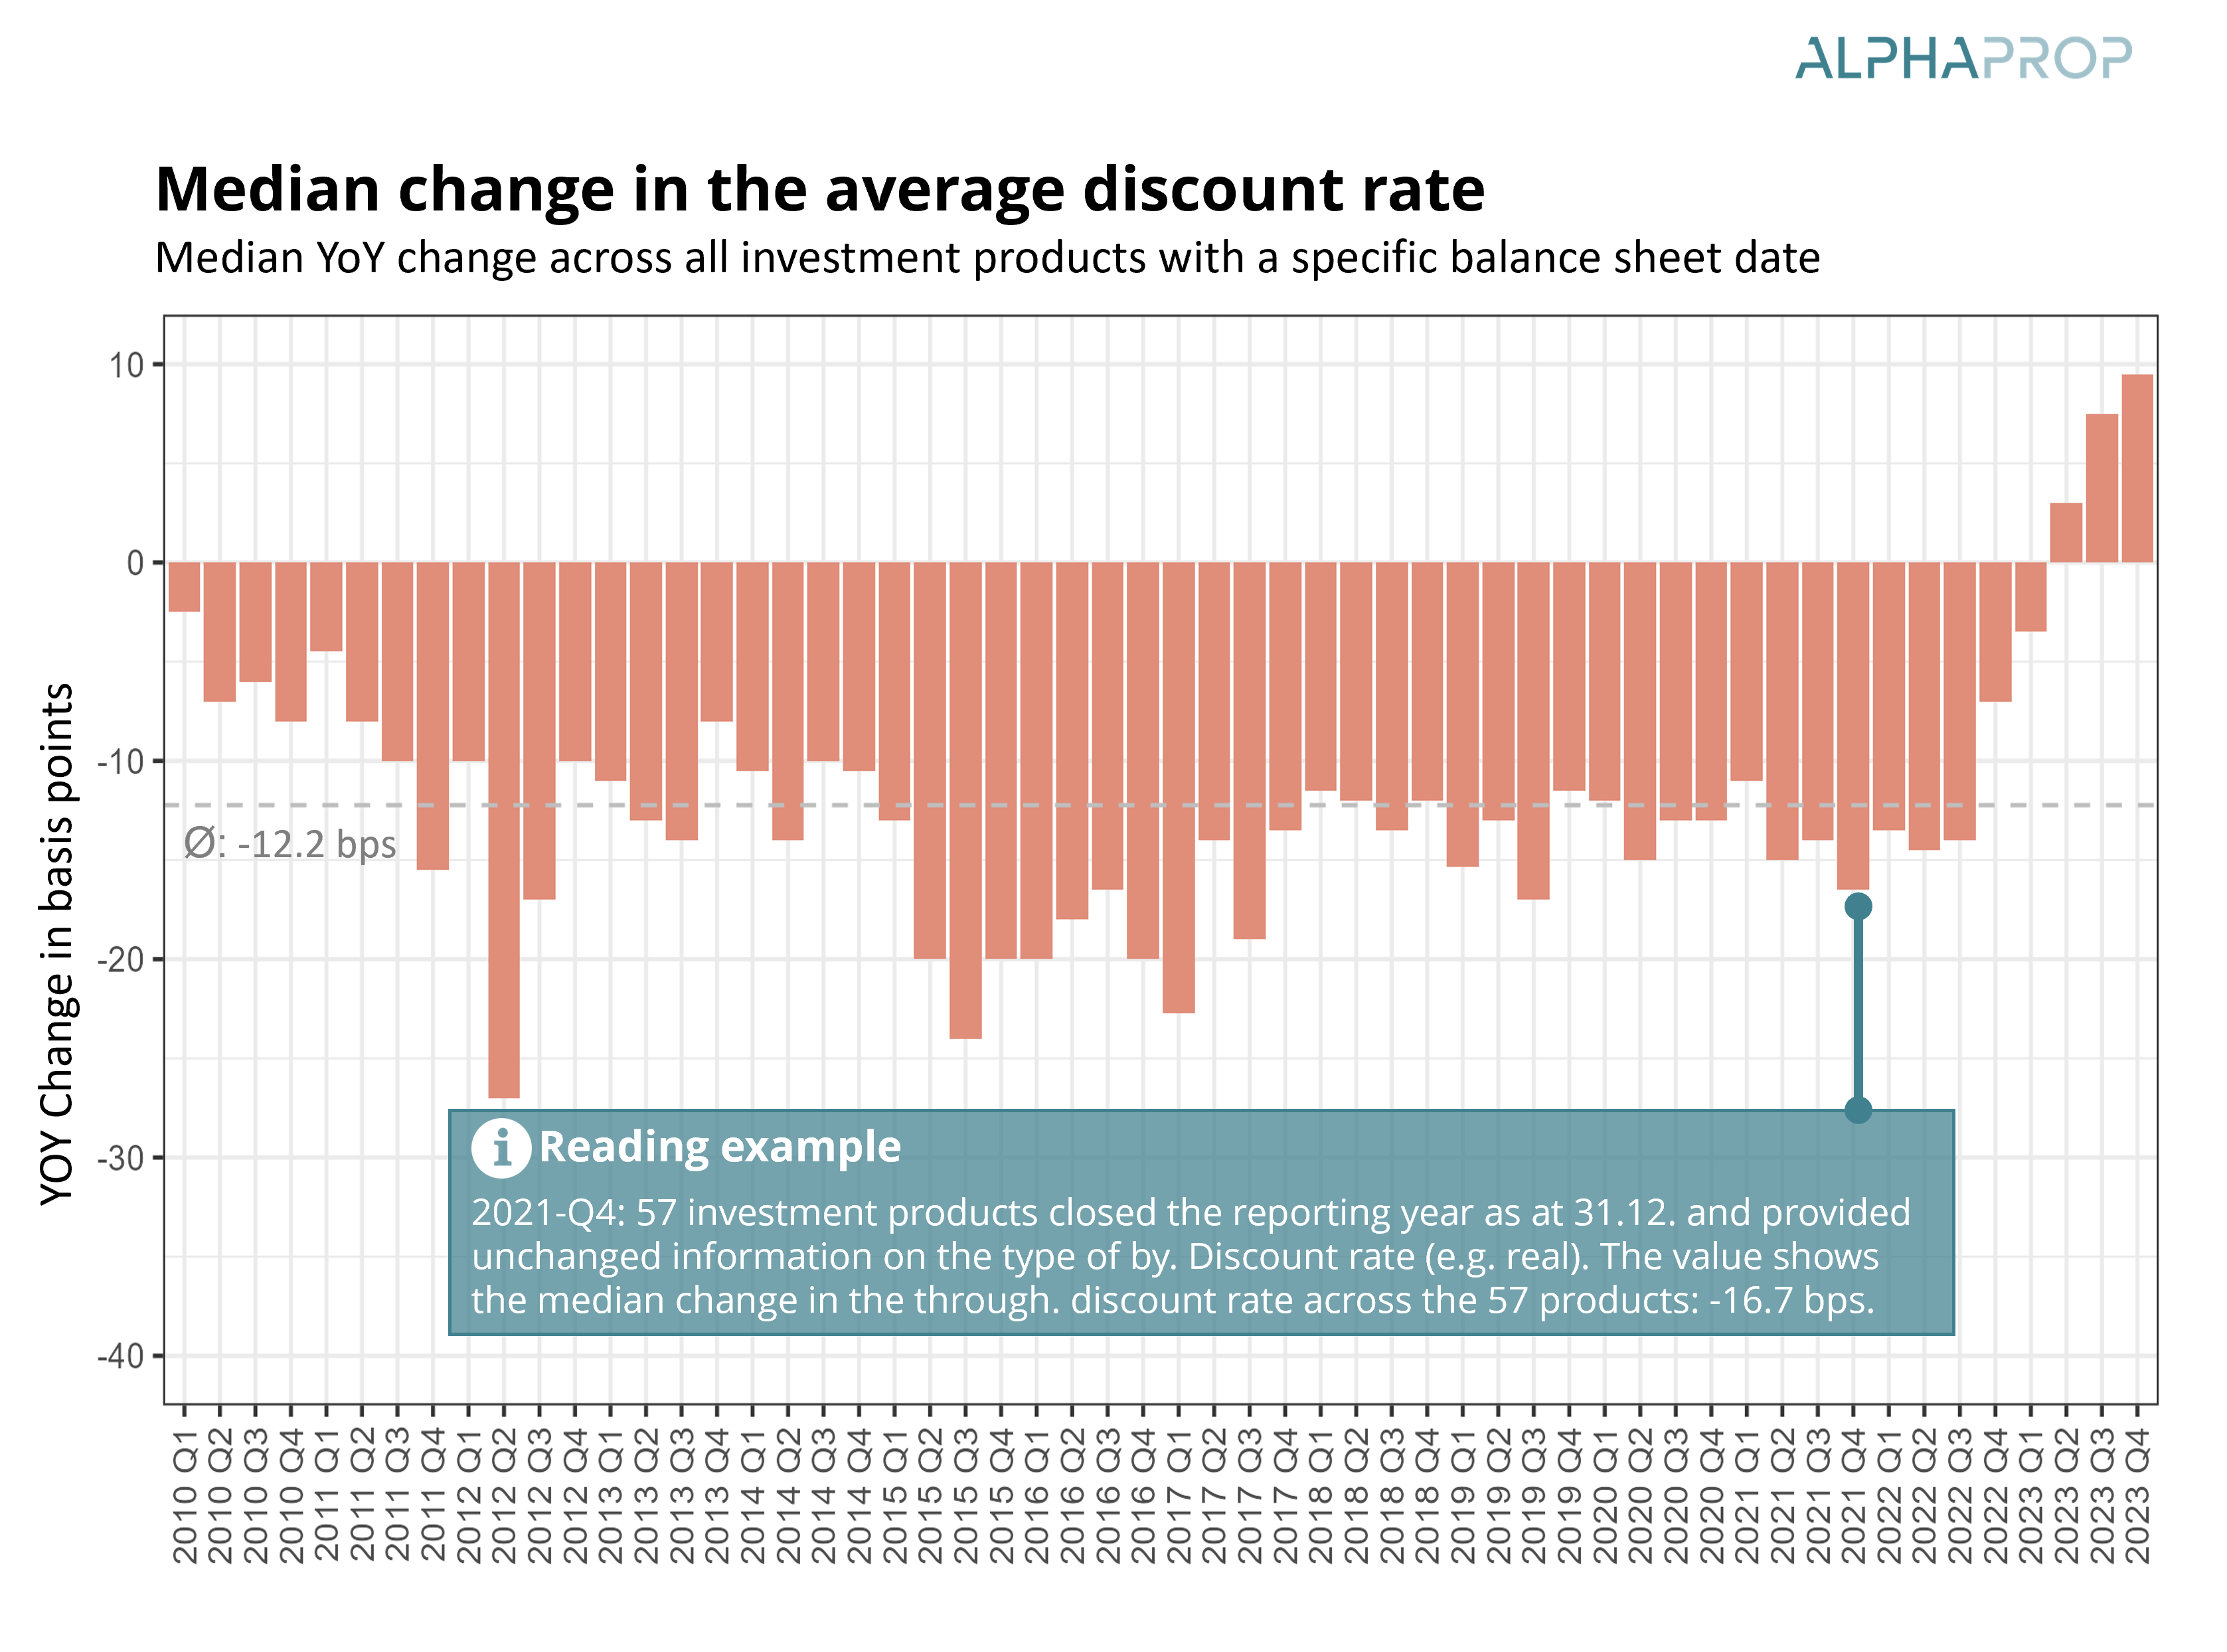
The long-awaited correction in valuations has already become apparent in the financial statements for Q2 and Q3 2023. The following chart shows the median change in the average discount rate per portfolio. The inflation expectation applied in the valuation, which is reflected in the difference between the real and nominal discount rate, was increased over 2023. In order to primarily capture the change in the real discount rate and not the pure adjustment of the inflation expectation, only investment products that provide information on the real discount rate were taken into account.
2023 was the first quarter to show an increase in the median discount rate. In 2023-Q4, the median value was +9.5bp. Accordingly, a clear majority of investment products recorded capital losses due to devaluations.
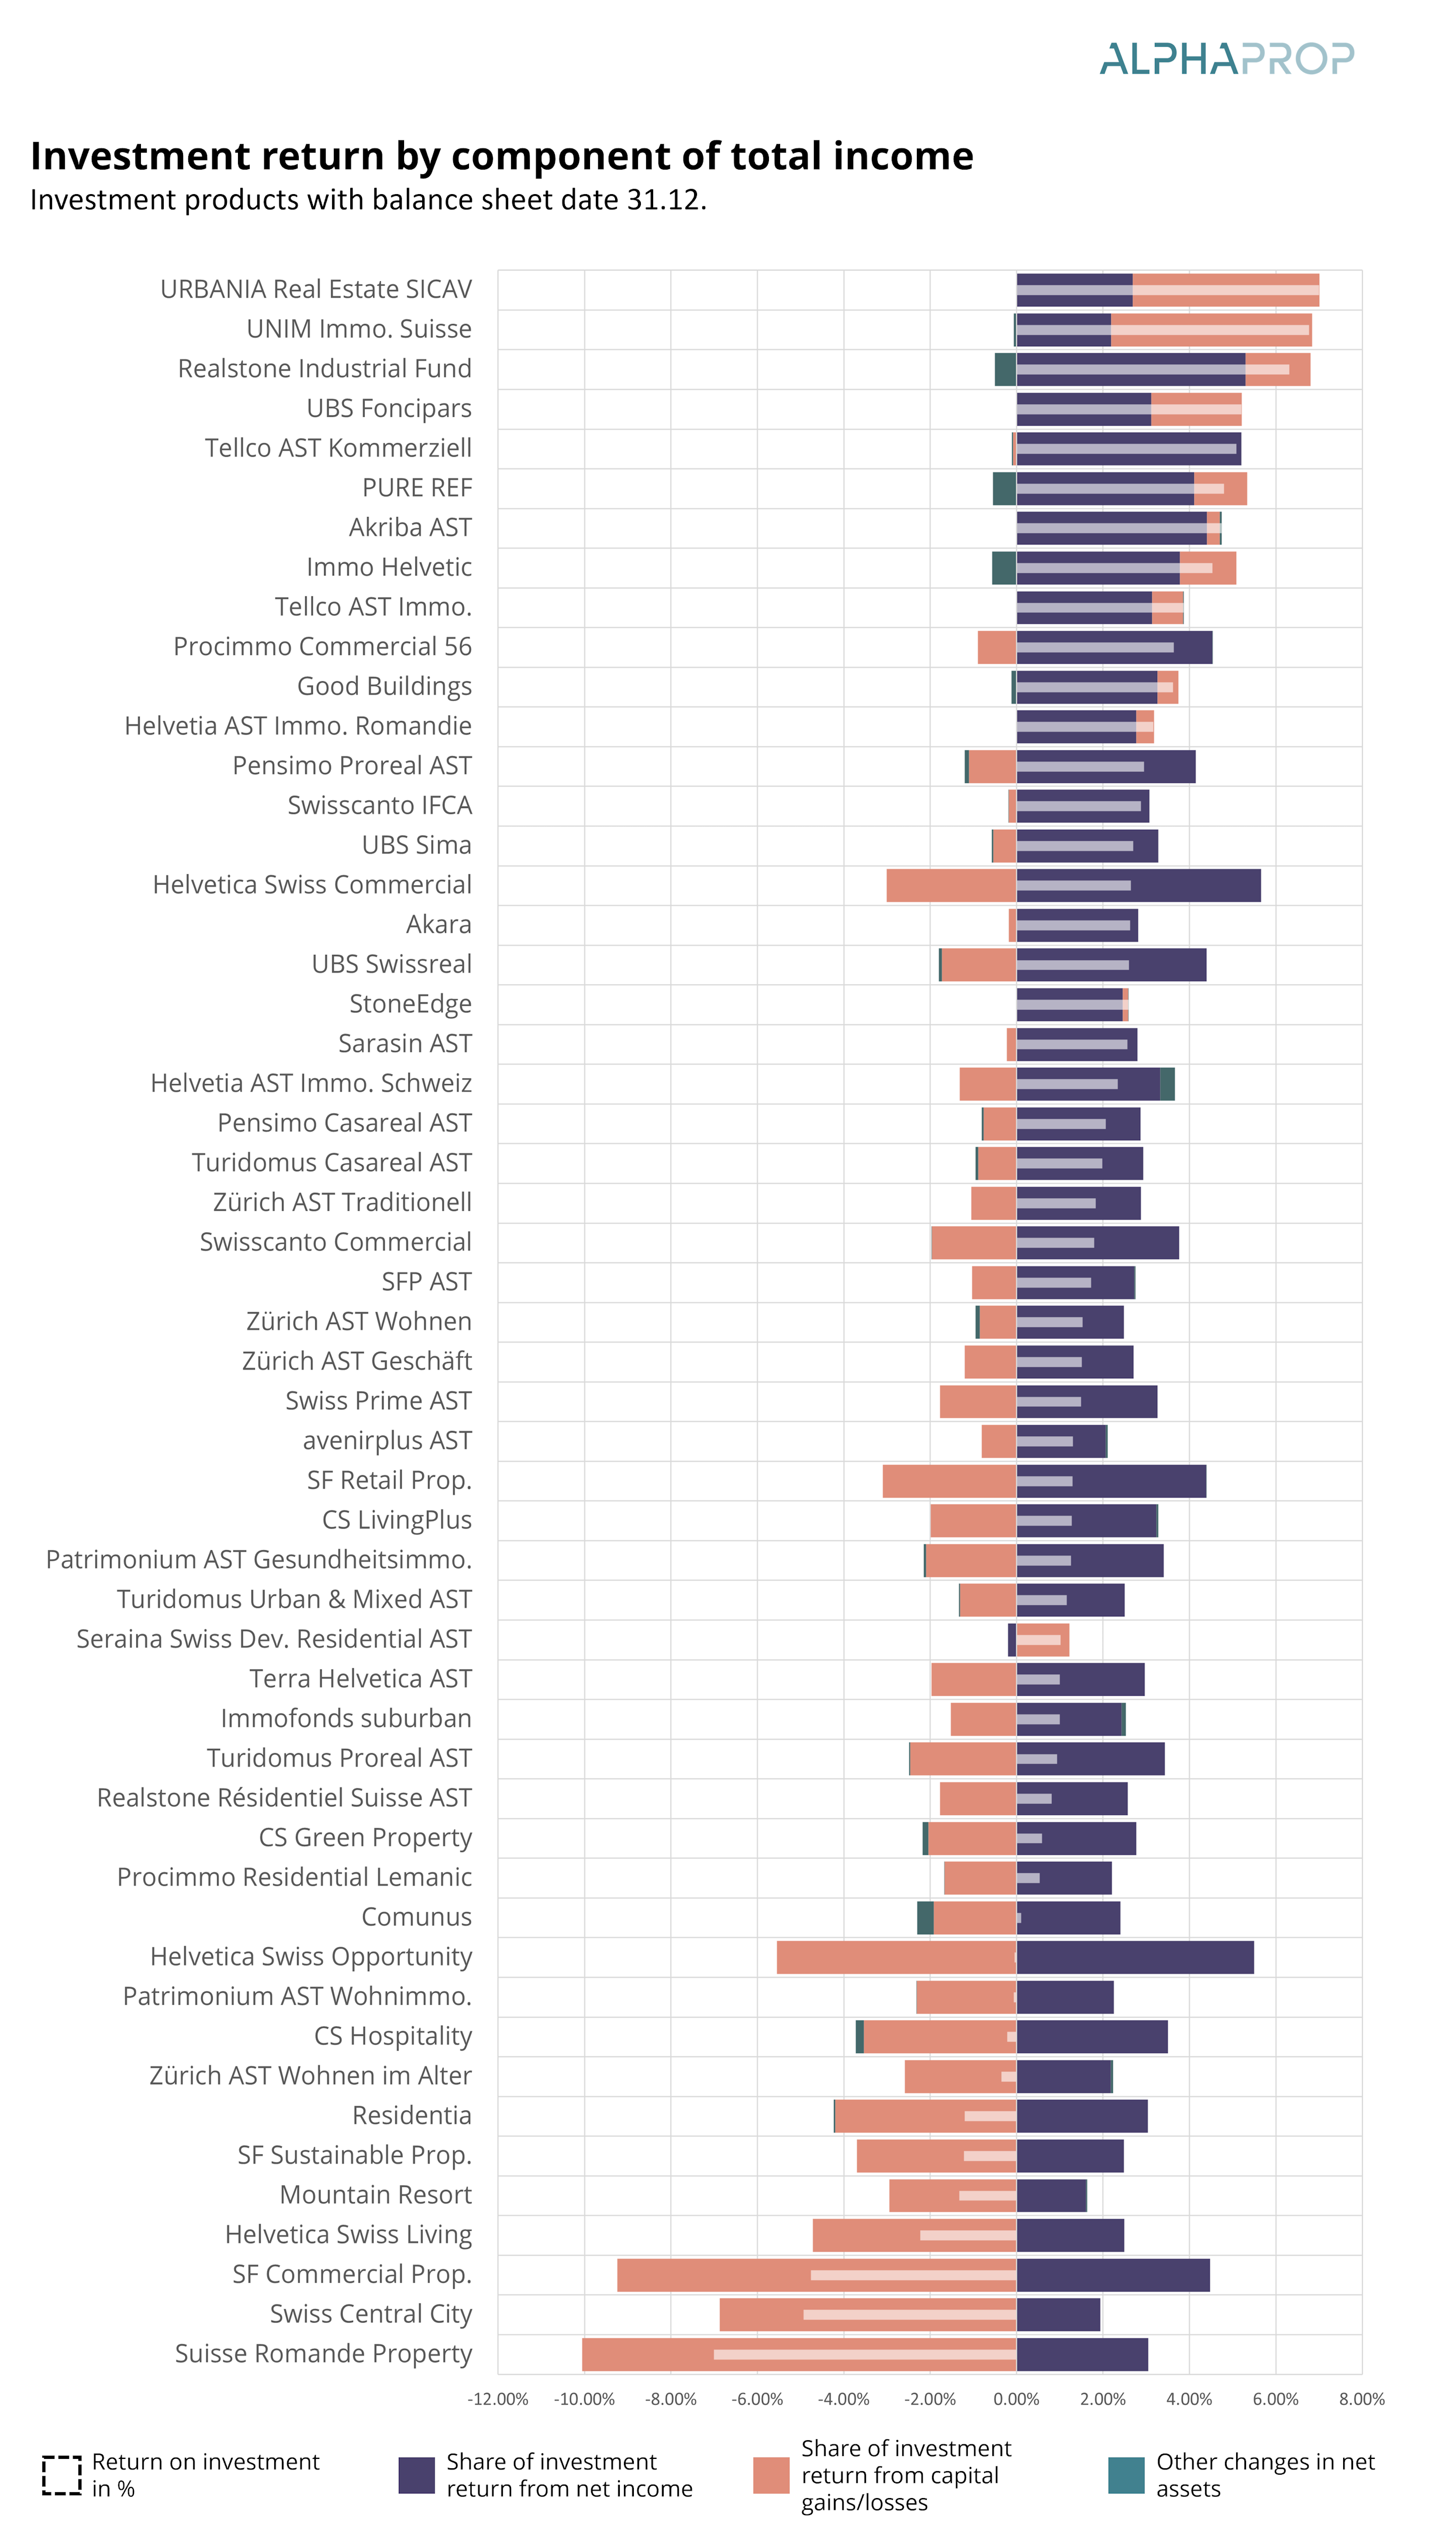
The following chart shows the investment returns of 53 vehicles (real estate funds and investment groups) that closed the financial year on December 31. In line with the income statement, we divide the investment return into a portion from net income, a portion from capital gains and losses and a portion from other changes.
Compared to previous analyses, the method has been refined to better reflect special effects, for example from major capital increases.
In total, the vehicles comprise properties with a market value of over CHF 65 billion and net assets of over CHF 50 billion. They account for around 35% of the market for funds and investment foundations with a focus on real estate in Switzerland.
On average, 3.15% was generated through net income. -1.49% comes from realized and unrealized capital gains and losses. -0.05% of the return comes from other sources and primarily relates to investment products with significant unit turnover or with large allocations to provisions for repairs.
A comparison of the change in valuation by use for investment products with information on prime costs (primarily real estate funds) shows that residential properties were valued -0.6% lower than in the previous year. The valuations of commercial properties fell by 2.2%. There were devaluations in all major regions. Vacancy rates in the portfolios of investment products as at 31.12. (analyzed if the information is available) fell slightly across all uses. For residential properties, the value for the analyzed investment vehicles is 2.7%. In 2020, the figure was still 4.8%, which represents a significant decline and illustrates the situation on the residential market.
Overall, the majority of investment products remain solid even in an environment of higher interest rates and rising discount rates. Slight devaluations and lower investment returns were to be expected. Following a very good performance in recent months, the valuation of listed real estate funds is already relatively high again and, in a long-term comparison with the 10-year CHF swap rate, the agios are quite in line with the long-term trend.3
1 Federal Statistical Office: CPI-Calculator, https://lik-app.bfs.admin.ch/
2 We determine the net income per unit in CHF, the capital gain/loss per unit in CHF and the investment return per unit in CHF. The other income per unit is determined as investment return in CHF – net income in CHF – capital gain/loss in CHF (always per unit). The investment return is then divided between the 3 components.
3 See slide 4 in the Credit Suisse Asset Management report: https://am.credit-suisse.com/content/dam/csam/docs/real-estate/key-facts/immobilienfonds-20240430-en.pdf
Would you like to learn more about Alphaprop and its data universe? Contact us for a free demo login or a product presentation:
(*mandatory fields)

Jetzt anmelden und auf dem Laufenden bleiben: